Google Analytics 4 for Beginners: Your First Dashboard

Jan van Dijk
February 17, 2026 · 9 min read


When I first switched from Universal Analytics to GA4 back in 2023, I felt completely lost. The interface looked different, the terminology had changed, and half the reports I relied on seemed to have vanished. If you are feeling the same way right now, take a deep breath — I have been exactly where you are, and I promise it gets easier.
This Google Analytics 4 tutorial will walk you through everything you need to know to get started. By the end, you will have a working dashboard and a solid understanding of how GA4 tracks your website visitors. No prior analytics experience required.
What Is Google Analytics 4?
Google Analytics 4 (commonly called GA4) is Google’s current analytics platform for measuring website and app traffic. It replaced the older Universal Analytics in July 2023.
The biggest change? GA4 uses an event-based data model instead of the old session-based approach. In plain English, that means GA4 tracks individual actions (like clicking a button, watching a video, or scrolling down a page) rather than bundling everything into a single “session.”
Here is why that matters for you:
- More flexible tracking — you can measure almost any interaction without writing code
- Cross-platform insights — track users across your website and mobile app in one place
- Machine learning built in — GA4 can predict which users are likely to convert or leave
- Privacy-focused — designed to work in a world with fewer cookies and stricter privacy laws
As a web analyst working with small business clients in Amsterdam, I have set up GA4 on dozens of sites over the past two years. The learning curve is real, but once you understand the basics, GA4 is actually more powerful than what we had before.
Google Analytics 4 Tutorial: Setting Up Your Account
Getting GA4 running on your website takes about 15 minutes. Here is the step-by-step process.
Step 1: Create a Google Analytics Account
Go to analytics.google.com and sign in with your Google account. If you have never used Google Analytics before, click Start measuring to create your first account.
Fill in your account name (usually your company or website name), choose your data sharing settings, and click Next.
Step 2: Create a Property
A “property” in GA4 is basically your website or app. Give it a name, select your time zone and currency, then click Next. Google will ask about your business size and goals — answer honestly, as this helps GA4 customize your default reports.
Step 3: Set Up a Data Stream
Choose Web as your platform, enter your website URL, and give your stream a name. GA4 will generate a Measurement ID that looks like G-XXXXXXXXXX. Keep this handy — you need it to connect your website.
Step 4: Install the Tracking Code
You have several options for adding GA4 to your site:
- Google Tag Manager (recommended) — paste your Measurement ID into a new GA4 Configuration tag
- Direct install — copy the
gtag.jscode snippet into your website’s<head>section - WordPress plugin — use a plugin like Site Kit by Google for a no-code setup
I personally recommend Google Tag Manager for most sites. It gives you more control and makes future changes easier. But if you just want the simplest path, the WordPress plugin approach works fine.
Step 5: Verify It Works
After installing the code, go back to your GA4 property and click Realtime in the left sidebar. Open your website in another tab and browse a few pages. You should see your visit appear in the Realtime report within 30 seconds. If you see at least one active user, congratulations — GA4 is working.
Understanding the GA4 Dashboard

The GA4 interface is organized into several sections in the left sidebar. Here is what each one does:
Home
Your overview page. It shows a summary of users, new users, average engagement time, and total revenue (if you track purchases). The Home screen also displays AI-powered insights — automatic alerts about unusual traffic patterns or trends.
Reports
This is where you will spend most of your time. The Reports section contains pre-built reports organized into categories like Acquisition (where your visitors come from), Engagement (what they do on your site), and Monetization (revenue tracking). More on these below.
Explore
The Explore section lets you build custom reports using a drag-and-drop interface. It is powerful but more advanced — you can skip this for now and come back when you are comfortable with the standard reports.
Advertising
If you run Google Ads, this section shows how your ad campaigns perform. It connects your Google Ads data with your website analytics for a complete picture.
Key Reports Every Beginner Should Know
Out of all the reports available in GA4, these four are the ones I check most often for my clients.
1. Traffic Acquisition Report
Found under Reports > Acquisition > Traffic acquisition, this report shows you where your visitors come from. You will see channels like Organic Search, Direct, Social, Referral, and Paid Search.
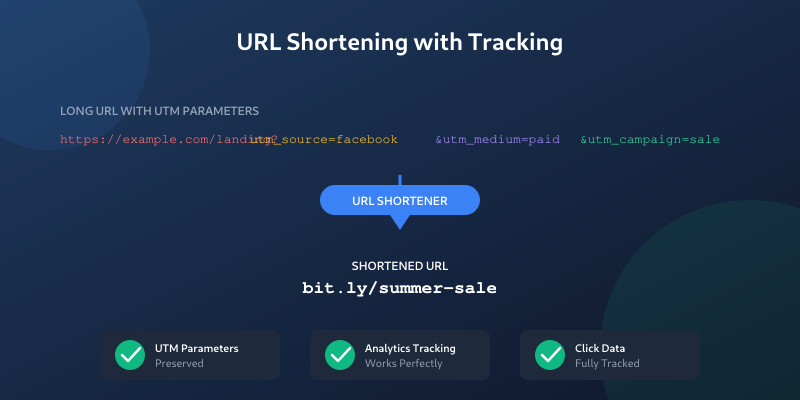
This report is especially useful when you are running marketing campaigns. If you use UTM parameters on your campaign links, GA4 will break down your traffic by source, medium, and campaign name. You can build UTM-tagged URLs quickly with our free UTM Builder tool.
2. Pages and Screens Report
Located under Reports > Engagement > Pages and screens, this shows which pages on your site get the most views. You can sort by views, average engagement time, or conversions to find your best-performing content.
When I first looked at this report for my own blog, I discovered that one article was getting ten times more traffic than everything else combined. That insight helped me plan my next five articles around similar topics.
3. Landing Page Report
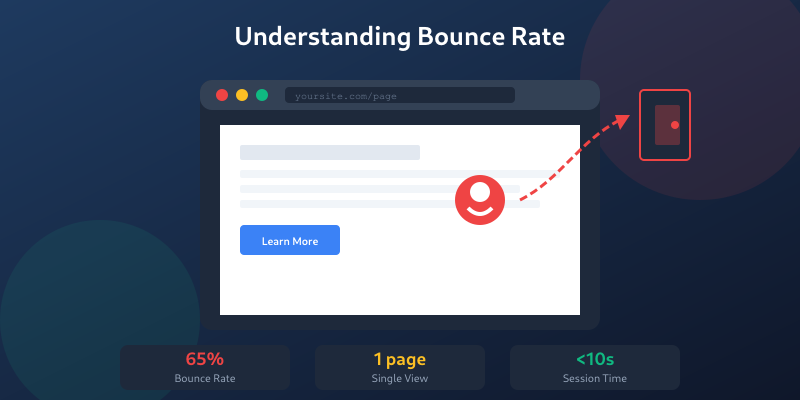
This one lives under Reports > Engagement > Landing page. It shows which pages people see first when they arrive at your site. This is critical because your landing pages form the first impression visitors get of your brand.
Pay attention to the bounce rate column here. A high bounce rate on a landing page might mean the page is not meeting visitor expectations — or it could simply mean visitors found what they needed quickly. Context matters.
4. Tech Details Report
Under Reports > Tech > Tech details, you can see what browsers, operating systems, and screen sizes your visitors use. This helps you decide which devices to prioritize when designing or testing your website.
Events and Conversions in GA4
Events are the foundation of GA4. Every interaction on your website is tracked as an event. Some events are collected automatically, while others you need to set up yourself.
Automatically Collected Events
GA4 tracks these without any extra setup:
page_view— fires every time someone loads a pagescroll— fires when a user scrolls to 90% of the pageclick— tracks outbound link clickssession_start— marks the beginning of a new sessionfirst_visit— fires the first time someone visits your site
You can enable additional enhanced measurement events (like file downloads, video engagement, and site search) in your data stream settings. I recommend turning all of these on — they are free data you would otherwise miss. Check the Google Analytics documentation on enhanced measurement for the full list.
Custom Events
Need to track something specific, like a form submission or button click? If you work with GA4 event data exports or API responses, our JSON formatter makes it easy to read nested JSON structures. You can create custom events using Google Tag Manager or the GA4 interface. Google’s event reference documentation has detailed instructions for setting these up.
Marking Events as Conversions
Any event in GA4 can be marked as a “key event” (formerly called a conversion). To do this, go to Admin > Events, find the event you want, and toggle the Mark as key event switch.
Common key events include form submissions, purchases, newsletter signups, and phone calls. Once an event is marked as a key event, it will appear in conversion columns throughout all your reports.
Common Mistakes Beginners Make
Over the past two years, I have seen the same mistakes come up again and again. Here are the ones to watch out for:
1. Not Filtering Internal Traffic
If you visit your own website frequently (and you probably do), your visits will inflate your traffic numbers. Set up an internal traffic filter in Admin > Data Streams > Configure tag settings > Define internal traffic. Add your IP address (GA4 supports regex patterns for filters — test yours with our regex tester) and then activate the filter in Admin > Data Settings > Data Filters.
2. Ignoring Data Retention Settings
By default, GA4 only keeps detailed user data for 2 months. Go to Admin > Data Settings > Data Retention and change it to 14 months. This does not affect your standard reports, but it matters when you use the Explore section for custom analysis.
3. Comparing GA4 Numbers to Universal Analytics
GA4 and Universal Analytics measure things differently. Sessions, users, and especially bounce rate are calculated using different methods. Do not panic if your GA4 numbers look different from what you remember — it is expected. Start fresh with GA4 as your new baseline.
4. Not Connecting Google Search Console
Linking your Google Search Console account to GA4 gives you valuable search query data. Go to Admin > Product Links > Search Console Links and follow the prompts. It takes two minutes and is absolutely worth it.
5. Creating Too Many Custom Events Too Soon
GA4 has a limit of 500 distinct events per property. That sounds like a lot, but I have seen clients burn through them by creating overly granular events. Start with enhanced measurement and only add custom events when you have a clear business question you need to answer.
Frequently Asked Questions
Is Google Analytics 4 free to use?
Yes. GA4 is completely free for most websites. There is a paid version called Google Analytics 360 for enterprise users who need higher data limits and advanced features, but the free version handles up to 10 million events per month, which is more than enough for small to medium websites.
How long does it take for data to appear in GA4?
Realtime data appears within about 30 seconds. Standard reports typically update within 24 to 48 hours. When you first set up GA4, give it at least a full week before drawing any conclusions — you need enough data for the numbers to be meaningful.
Can I use GA4 without cookies?
GA4 is designed to work with reduced cookie availability. It uses machine learning to fill in data gaps when cookies are blocked or declined. However, for the most accurate data, cookie consent is still recommended. GA4 also supports consent mode, which adjusts tracking behavior based on your visitors’ cookie preferences.
What is the difference between users and sessions in GA4?
A user is a unique visitor to your website. A session is a single visit. One user can have multiple sessions — for example, if someone visits your site on Monday and again on Thursday, that counts as one user but two sessions. GA4 focuses more on users than sessions compared to the old Universal Analytics.
Do I need Google Tag Manager to use GA4?
No. You can install GA4 using the direct gtag.js code snippet or a WordPress plugin. However, Google Tag Manager makes it much easier to add custom events, manage multiple tracking tools, and make changes without editing your website code. For anything beyond basic page tracking, I strongly recommend using Tag Manager.
Next Steps
You now have the foundation to start using Google Analytics 4 with confidence. Here is what I suggest you do next:
- Set up GA4 on your website if you have not already
- Enable enhanced measurement to capture scroll, click, and search events automatically
- Filter your internal traffic so your own visits do not skew the data
- Check your reports weekly — even ten minutes each Monday morning will teach you a lot
- Learn about UTM parameters to track your marketing campaigns properly — read our beginner’s guide to UTM parameters
Analytics is a skill you build over time. When I started, I could barely find the traffic report. Now I help businesses across the Netherlands make data-driven decisions every day. Give yourself grace, stay curious, and keep experimenting with GA4. The data will start making sense sooner than you think.
Written by Jan van Dijk
Independent web analyst from Amsterdam. I help small businesses understand their data and build tools that make everyday web tasks easier.
More about me