How to Read a Google Analytics Report (Without Panicking)

Jan van Dijk
March 14, 2026 · 8 min read

I remember the first time a client showed me their GA4 dashboard and asked, “so what does all this mean?” I froze. There were charts, numbers, percentages everywhere. Years later, I’ve learned that reading an analytics report is actually straightforward once you know what to look for.
Google Analytics can feel overwhelming at first glance. But here is the truth: you do not need to understand every single number on the screen. Learning how to read a Google Analytics report is simpler than you think — most website owners only need to pay attention to a handful of metrics. In this guide, I will walk you through it step by step, so you can stop panicking and start making smarter decisions about your website.

The Home Screen: Your Dashboard Overview
When you first log into Google Analytics 4 (GA4), you land on the Home screen. Think of this as your website’s daily health check. It shows you a quick summary of what happened recently.
On the Home screen, you will see:
- Users — the number of unique people who visited your site
- New users — first-time visitors
- Event count — total interactions (clicks, page views, scrolls)
- Average engagement time — how long people actually spent interacting with your pages
Do not get lost in the details here. The Home screen is just a snapshot. If something looks unusual — like a sudden spike or drop — that is your cue to dig deeper into the specific reports below.
Real-Time Reports: What Is Happening Right Now
The Real-Time report shows you who is on your website at this very moment. You can find it in the left sidebar under Reports > Realtime.
This report is useful when you have just published a new blog post, sent out a newsletter, or launched a social media campaign. You can see if people are actually arriving. But I will be honest: I rarely use the Real-Time report for day-to-day analysis. It is more of a “did my campaign go live?” check than a planning tool.
You will see a map showing where current visitors are located, which pages they are viewing, and which events they are triggering. It updates every few seconds, which can be fun to watch but is not where you should spend most of your time.
How to Read a Google Analytics Acquisition Report
This is one of the most important sections in Google Analytics. The Acquisition report answers a simple question: how did people find your website?
Navigate to Reports > Acquisition > Traffic acquisition to see a breakdown of your traffic sources. GA4 groups them into channels like:
- Organic Search — people who found you through Google, Bing, or another search engine
- Direct — visitors who typed your URL directly or used a bookmark
- Referral — traffic from other websites linking to yours (learn more about what referral traffic means)
- Organic Social — visitors from social media posts (not paid ads)
- Paid Search — traffic from Google Ads or other paid search campaigns
- Email — clicks from email campaigns
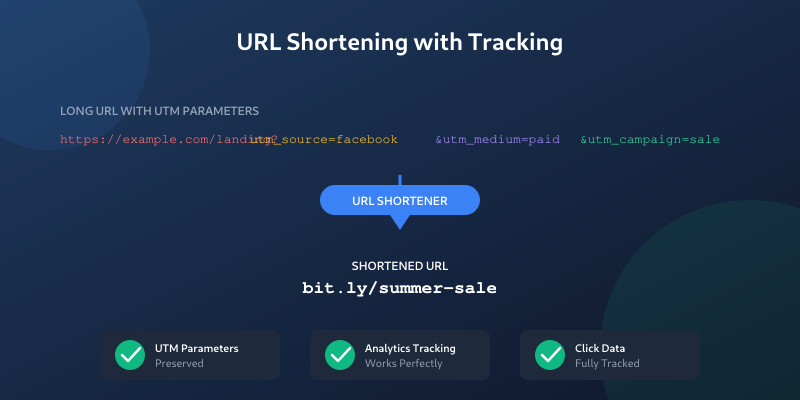
If you are using UTM parameters in your links, this is where they show up. UTM tags help you see exactly which campaign, source, or medium brought a visitor to your site. Without them, a lot of your traffic might just show up as “Direct” or “Unassigned.”
In my experience, the Acquisition report is where most actionable insights live. If 80% of your traffic comes from organic search, you know that SEO is working. If social media is sending almost no one, maybe it is time to rethink your social strategy — or stop spending time there altogether.
Engagement Reports: What People Do on Your Site
Once visitors arrive, what do they actually do? The Engagement reports tell you this. Go to Reports > Engagement to explore.
The key sub-reports here are:
Pages and Screens
This shows which pages on your website get the most views. You can sort by views, users, average engagement time, or event count. I check this report weekly to see which content resonates with readers and which pages might need updating.
Events
In GA4, everything is an event. A page view is an event. A scroll is an event. A click is an event. The Events report lists all of these interactions. When you are just starting out, focus on these default events:
- page_view — someone loaded a page
- scroll — someone scrolled to 90% of a page
- click — someone clicked an outbound link
- first_visit — a new user arrived
- session_start — a new session began
Landing Pages
This report shows which pages people see first when they arrive on your site. It is different from the Pages report because it only counts the first page in each session. If your homepage is always the top landing page but a blog post is getting no entry traffic, that post might have SEO problems.

Retention: Are People Coming Back?
The Retention report (under Reports > Retention) shows whether visitors return to your site after their first visit. This is especially important for content sites, online stores, and apps.
You will see two main views:
- New vs. returning users — a simple split showing how many visitors are new and how many have been before
- User retention by cohort — groups of users based on when they first visited, showing how many came back in the following days or weeks
For most small websites, retention rates are naturally low. Do not panic if only 10-20% of visitors come back. That is normal. But if you run a blog and nobody ever returns, it might be worth looking at your email subscription strategy or content quality.
Key Metrics to Focus On
Here is my honest advice after years of working with analytics: ignore most of the numbers at first. Focus on these metrics that actually matter for decision-making.
Users vs. Sessions
A user is one person. A session is one visit. The same person can have multiple sessions. If you have 100 users and 150 sessions, that means some people visited more than once. Understanding the difference between sessions and users is fundamental to reading any analytics report correctly.
Engagement Rate
In GA4, the engagement rate replaced the old bounce rate from Universal Analytics. An engaged session is one where the visitor stayed for at least 10 seconds, viewed two or more pages, or triggered a conversion event. A high engagement rate (above 60%) is generally good. You can also read our guide on what bounce rate means for more context on this metric.
Average Engagement Time
This tells you how long users actively interact with your site. Unlike the old “session duration” metric, engagement time only counts the time when your website tab is in the foreground and active. For a blog article, 2-4 minutes of engagement time is a healthy sign that people are actually reading your content.
Conversions (Key Events)
GA4 recently renamed conversions to “key events.” These are the actions that matter most to your business — a form submission, a purchase, a sign-up. You need to set these up manually in Admin > Events, then mark specific events as key events.
Creating Custom Reports
The built-in reports in GA4 are a solid starting point, but sometimes you need something specific. GA4 lets you create custom reports in the Explore section.
To create a basic custom report:
- Click Explore in the left sidebar
- Choose Blank or a template like Free form
- Add dimensions (the “what” — like page title, country, or source) to the rows
- Add metrics (the “how much” — like users, sessions, or engagement rate) to the values
- Apply date ranges and filters as needed
If this feels too advanced right now, do not worry. The standard reports cover 90% of what most website owners need. Google also offers free courses through Google Skillshop that walk you through the Explore interface step by step.
Common Mistakes When Reading Analytics Reports
Over the years, I have seen the same mistakes come up again and again. Here are the ones to watch out for:
Looking at Too Short a Time Period
One day of data tells you almost nothing. Traffic fluctuates naturally. Always compare at least a week or a month of data, and use the date comparison feature to see how things changed versus the previous period.
Ignoring Filters and Segments
Your overall numbers hide important patterns. A page might look like it is performing poorly overall, but when you filter by organic traffic only, it might actually be your best performer. Use filters and segments to break down data by traffic source, device type, or country.
Confusing Correlation with Causation
Just because traffic went up on the same day you posted on social media does not mean the social post caused it. Always check the actual traffic source data before drawing conclusions.
Not Setting Up Conversions
Without key events (conversions) set up, you are just counting page views. Page views alone do not tell you if your website is achieving its goals. Even a simple blog should track newsletter sign-ups or contact form submissions.
Panicking Over Normal Drops
Traffic drops on weekends. Traffic drops during holidays. Traffic drops when Google updates its algorithm. A single bad day or week is rarely a crisis. Look at trends over months, not individual days.
A Simple Weekly Routine
If you are new to analytics, here is a simple routine I recommend. Spend 15 minutes once a week checking these three things:
- Total users this week vs. last week — are you growing?
- Top traffic sources — where are people coming from?
- Top landing pages — which content is attracting visitors?
That is it. You do not need to check analytics every day. You do not need to understand every report. Start with these three data points, and expand your analysis as you get more comfortable. When creating content based on your analytics insights, use our word counter to ensure articles hit the right length for SEO.
As the official GA4 documentation puts it, the platform is designed to help you “understand the customer journey” — but that journey starts with you understanding the basics first.
Frequently Asked Questions
What is the most important metric in Google Analytics?
It depends on your website’s goal. For content sites, engagement rate and average engagement time are the most important because they show whether people actually read your content. For e-commerce, conversions (key events) and revenue matter most. Start by defining what success looks like for your website, then focus on the metrics that measure that.
How often should I check my Google Analytics reports?
For most small websites, once a week is enough. Checking daily can lead to overreacting to normal fluctuations. Set a weekly 15-minute routine to review users, traffic sources, and top pages. Only check more often during active campaigns or after major website changes.
What is the difference between GA4 and Universal Analytics?
Universal Analytics was the previous version of Google Analytics, which Google retired in July 2023. GA4 uses an event-based data model instead of the old session-based model. This means every interaction is tracked as an event. GA4 also introduced engagement rate to replace bounce rate and offers better cross-device tracking.
Why does my Google Analytics show different numbers than my hosting stats?
Google Analytics uses a JavaScript tracking code that only runs in browsers. Server-side hosting stats count every request, including bots, crawlers, and automated tools. GA also requires JavaScript to be enabled and can be blocked by ad blockers. It is normal for GA numbers to be 20-40% lower than your server logs.
Can I use Google Analytics for free?
Yes. Google Analytics 4 is completely free for most websites. There is a paid enterprise version called Google Analytics 360, but it is designed for very large businesses processing billions of events per month. The free version has no traffic limits and includes all the reports covered in this guide.
Written by Jan van Dijk
Independent web analyst from Amsterdam. I help small businesses understand their data and build tools that make everyday web tasks easier.
More about me